A bit on ElasticSearch + Logstash + Kibana (The ELK stack)
Edit - i have created a script for CentOS 6.5 for complete installation:
https://github.com/adionditsak/RELK.sh/blob/master/RELK.sh
What is the ELK stack
The ELK stack is ElasticSearch, Logstash and Kibana. Together they provide a fully working real-time data analytics tool. I have tested it with simple logs from my Debian machine. This article can help you getting started to understand the different parts, and to test it.
You parse your data with Logstash directly into the ElasticSearch node. ElasticSearch will then handle the data, and Kibana will vizualise the data for you.
ElasticSearch
ElasticSearch is a search engine with focus on real-time and analysis of the data it holds, and is based on the RESTful architecture. It comes with compatibility with standard full text search functionality, but also with much more powerful query options. ElasticSearch is document-oriented/based and you can store everything you want as JSON. This makes it powerful, simple and flexible.
It is build on top of Apache Lucene, and is on default running on port 9200 +1 per node.
Logstash
With Logstash you grab log data or any other time-based data, from wherever you want, and process it and parse it exactly as you want - structured JSON is a standard, and is also how ElasticSearch handles it. There is a lot of filter options and similar features you will experience. This is very useful to streamline your log reading, understanding and filtering.
Kibana
Kibana is the frontend part of the ELK stack, which will present the data stored from Logstash into ElasticSearch, in a very customizable interface with histogram and other panels which will create a big overview for you. Great for real-time analysis and search of data you have parsed into ElasticSearch, and very easy to implement.
Download
This URL provides resources to the newest versions:
http://www.elasticsearch.org/overview/elkdownloads/
To download the ElasticSearch tar:
$ curl -OL https://download.elasticsearch.org/elasticsearch/elasticsearch/elasticsearch-1.1.0.tar.gz
To download the Logstash tar:
$ curl -OL https://download.elasticsearch.org/logstash/logstash/logstash-1.4.0.tar.gz
To download the Kibana tar:
$ curl -OL https://download.elasticsearch.org/kibana/kibana/kibana-3.0.0.tar.gz
To extract (tar -xzvf) them all at once:
$ tar -xzvf logstash-1.4.0.tar.gz kibana-3.0.0.tar.gz elasticsearch-1.1.0.tar.gz
This will result in 3 directories with the files you need to run the ELK stack.
Getting started with the ELK stack
Dependency: Java
To run ELK you need Java. Make sure it is installed in your system with:
$ java -version
If it is not, installed it with apt-get:
$ apt-get install openjdk-7-jre
This should be enough to continue.
ElasticSearch
Jump into your ElasticSearch directory (elasticsearch-1.1.0/) with cd.
Run the elasticsearch-file inside the ./bin/ folder with the following line:
$ ./bin/elasticsearch.
This will start a master node on port 9200. Go to your public address to see the search engine in action. I recommend just to use cURL:
$ curl -X GET http://109.202.159.44:9200
{
  "status" : 200,
  "name" : "Master Khan",
  "version" : {
    "number" : "1.1.0",
    "build_hash" : "2181e113dea80b4a9e31e58e9686658a2d46e363",
    "build_timestamp" : "2014-03-25T15:59:51Z",
    "build_snapshot" : false,
    "lucene_version" : "4.7"
  },
  "tagline" : "You Know, for Search"
}
To insert stuff you can use PUT, as it is a part of the REST (representational state transfer) architecture. If you are new to this, you should read up on REST. With REST we can use the following methods: GET (select resource), POST (create resource), PUT (update/create resource), DELETE (delete resource).
Then to do a simple search, i could use the "search?" request build into ElasticSearch, like this:
$ curl -X GET http://109.202.159.44:9200/search?=testsearchpattern
To create a record i could do:
$ curl -X POST 'http://109.202.159.44:9200/person/1' -d '{
    "info" : {
        "height" : 2,
        "width" : 20
    }
}'
Which then will give me a success message in JSON in return if it was created. This can the be retrieved with the -X GET parameter at same URL.
Logstash will automatically handle all the GET/POST/PUT etc. resources with ElasticSearch, when ElasticSearch has been declared to be the "host" for Logstash in your Logstash configuration. All you have to do is to turn ElasticSearch on (./bin/elasticsearch). Then you should be ready to proceed.
Logstash
Jump into your Logstash directory (logstash-1.4.0/) with cd.
Test Logstash's functionality with the most simple configuration possible:
./bin/logstash -e 'input { stdin { } } output { stdout { codec => rubydebug } }'
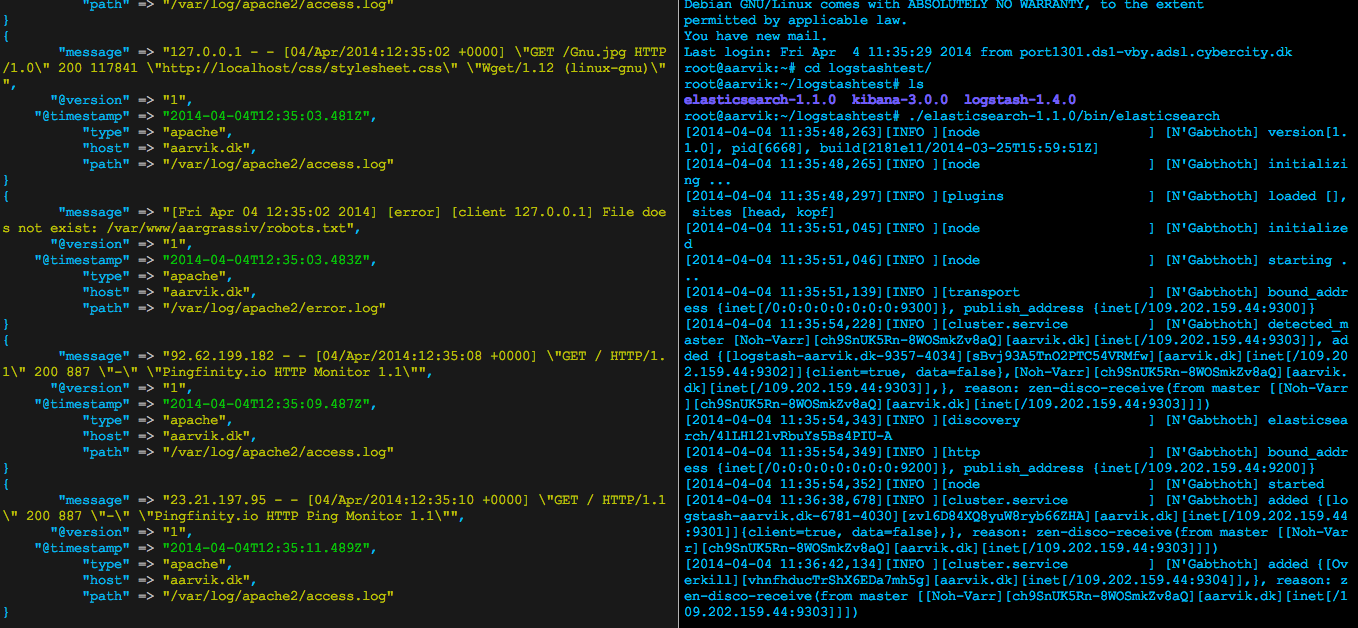
This will grab content from your stdin and output it as stdout. Then we use the "rubydebug" codec to format it. The result is on the first screenshot further in the article at the left side of the picture.
The same thing will happen with the logs it will read. Logstash will follow them real-time, pretty much like a follow flag on the tail cmd (tail -f logsfile.log) does, but then it will parse the data with the filters and options from your Logstash configuration, and store it into ElasticSearch.
Lets make an simple Logstash configuration file:
input {

     file {
         type => "apache"
         path => ["/var/log/apache2/access.log", "/var/log/apache2/error.log"]
     }

     file {
         type => "ssh"
         path => "/var/log/auth.log"
     }

     file {
         type => "syslog"
         path => "/var/log/syslog"
     }
 }

 output {
     elasticsearch {
         host => localhost
     }

     stdout {
         codec => rubydebug
     }
 }
Here you tell Logstash to look out for the Apache access.log and error.log, the auth.log for remote access and the syslog for general system logs, and then parse them into ElasticSearch at host "localhost". You also tell it to make stdout in the same codec as before, so you can see what is going on.
The -e flag we used earlier made it possible to make a configuration directly in the CLI. Now we want to put what we just wrote into a file, lets call it logstash.conf.
With the file, we need to use the -f flag instead. Run ./bin/logstash -f logstash.conf.
If no errors is showing, and you can see the rubydebug stdout, you have successfully made your first logstash configuration file.
There is a lot of useful things to do with Logstash tho, so you need to look much more into eg. filters with grok.
Keep ./bin/logstash -f logstash.conf running, and make sure you also have the ElasticSearch node running. Then you can start to test it, with queries to the ElasticSearch node. See what you get in return.
To get an overview over the many logs you parse and filter through Logstash to ElasticSearch, lets set up Kibana.
Kibana
In the Kibana directory you will only have a lot of HTML/CSS and JavaScript. It is nothing more but the frontend, which will listen to the ElasticSearch node holding the data with the RESTful search functionality which Kibana is using. So lets set it up.
Move the files from that directory (kibana-3.0.0) into a directory which is connected with your web server, so we can serve the Kibana files through HTTP.
If you do not have one, you can eg. install Nginx or Apache2. I made a small article about installation of Apache here: Initial web server setup with Apache, mod_rewrite and Virtual Host.
The only thing you have to do after you have insured that the Kibana files is on a listening HTTP server is to edit the config.js file in Kibana's root directory.
So go edit the file with your prefered editor (in my case Vim): $ vim config.js.
You then have to edit the "elasticsearch" object with the value of what ElasticSearch it should listen on. In my case my node running on port 9200:
 ...
  * elasticsearch host
  */
 elasticsearch: "http://109.202.159.44:9200",

 /** @scratch /configuration/config.js/5
  *
 ...
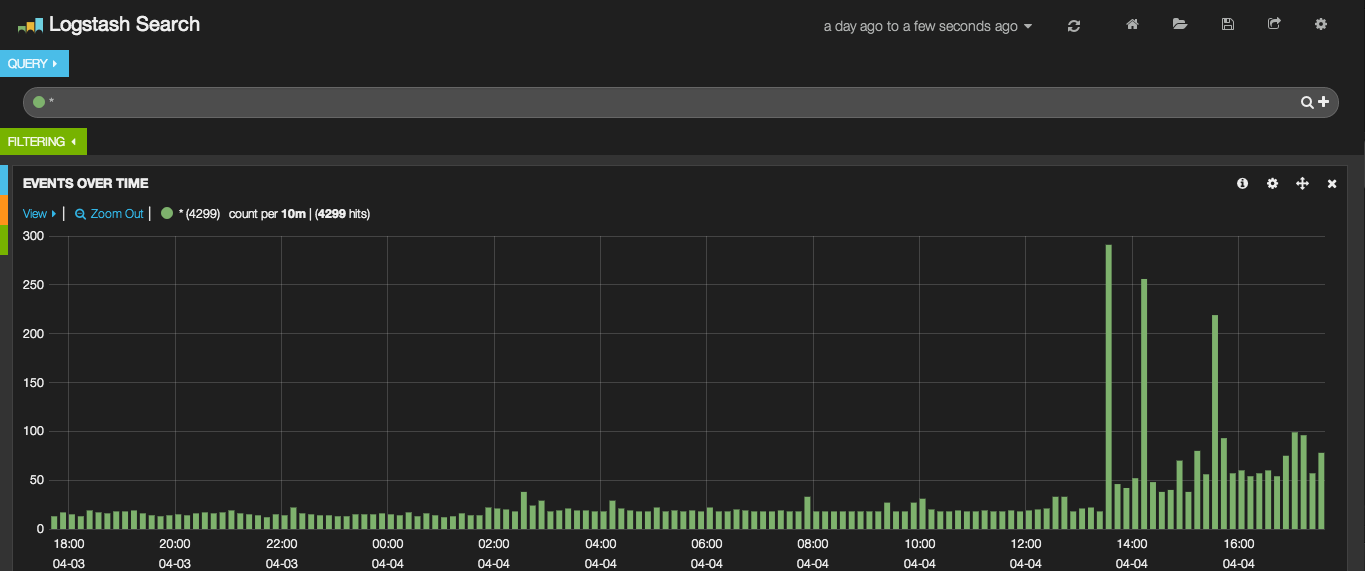
After you have saved this change, go and browse your Kibana installation in the directory you chose when you moved the installation to your web server. There is a predefined Logstash dashboard to get you started!
Make sure your ElasticSearch node + the Logstash parser is running as it should.
Screenshot
ElasticSearch and Logstash
Kibana
Resources
I recommend you to take a look at the official documentation of them all.
http://logstash.net/
http://elasticsearch.org/
http://kibana.org