Follow-up on "Linux server monitoring tools" - Hacker News suggestions in a list
This is a follow-up post on my previous post "Four Linux server moniting tools" which ended up on the frontpage of Hacker News for a pretty long time, and got a lot of great activity from a lot of people in the Hacker News community, and even people who has been developing on the mentioned tools.
There was so many great suggestions, so i have decided to make a list of a few of the most mentioned utils here, and with few comments on each of them. Then we have access to the collected utils from Hacker News, and explore the new suggested tools although the post have disappeared from Hacker News long time ago!
Feel free to comment if you think i have missed an important suggestion, or if you just have any comment to add. I appreciate that, no matter what you have to offer.
Original Hacker News thread, for descriptive comments:
https://news.ycombinator.com/item?id=7124720
Atop
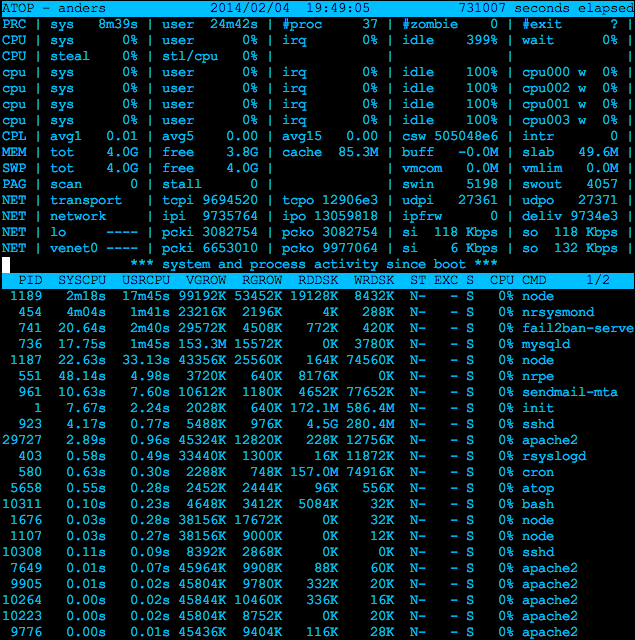
A lot of people told me it was weird that i did not have Atop in the original post. This was quite a coincidence together with that i have always liked htop, and never have compared them. I clearly see why tho. The data is very precise, and the key-toggle interface is very easy to use. I would almost say it is an all-you-need tool.
One of the smartest things about Atop which other diagnostic tools can not offer is the history log. You can actually jump back in time and see diagnostic data from a month back.
Be sure that the atop service is started:
$ sudo service atop start
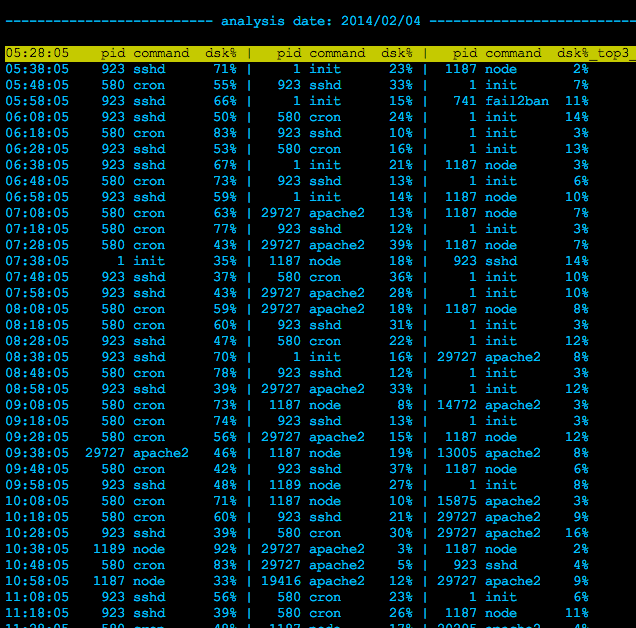
Take a look back a few days after and you will find logs in your /var/log directory. You can read them in the interface itself with atop -r, or with the report util from atop called atopsar, with atopsar -r, like here:
$ atop -r atop.log
$ atopsar -r atop.log
Screenshots:
nmon
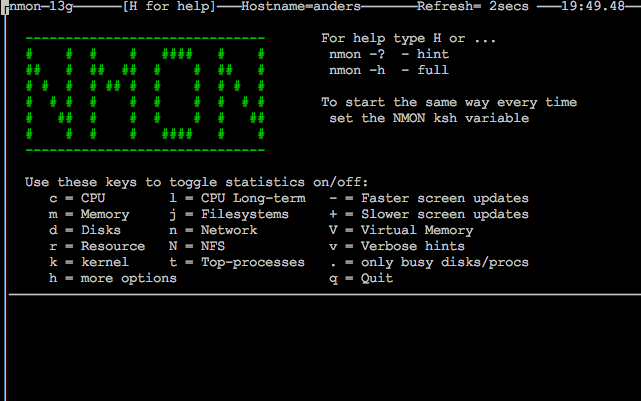
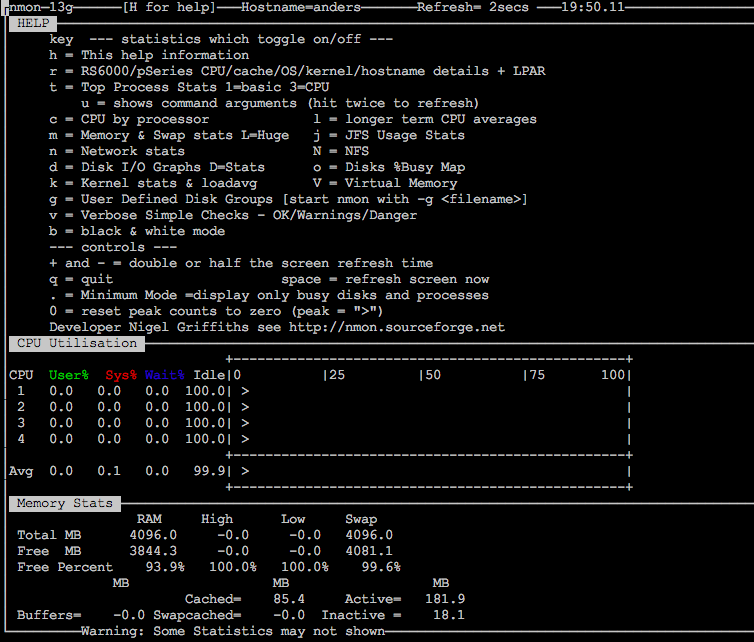
Nmon is also an amazing tool which comes with a very big overview of how to use it and the data it presents. After a few seconds you should feel comfortable in Nmon. You start in a help screen, which tells you have to toggle the windows - and this is the smart thing with nmon. You build up a overview of what you need with small parts of what you want to see, eg. press c + m + d + n to get a screen with everything you need for cpu, memory, disk and network monitoring. Recommended.
Screenshots:
GoAccess
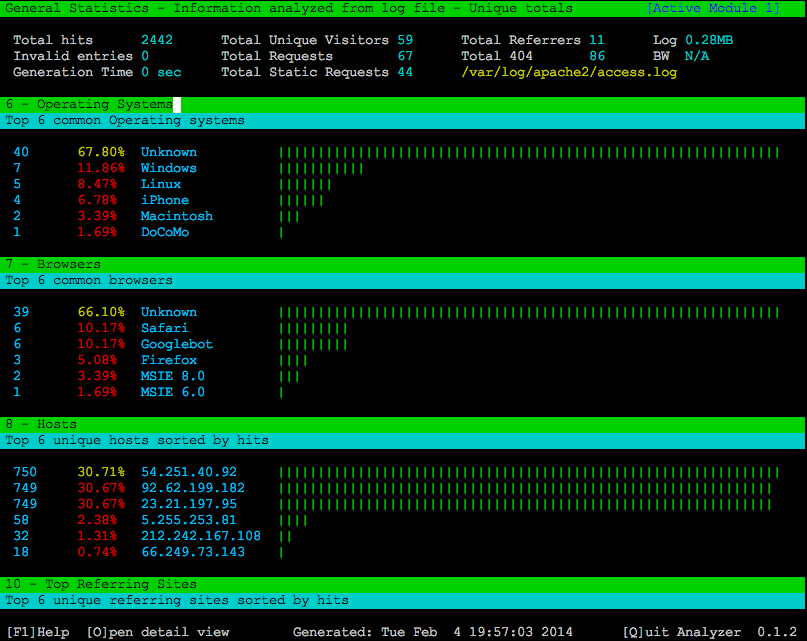
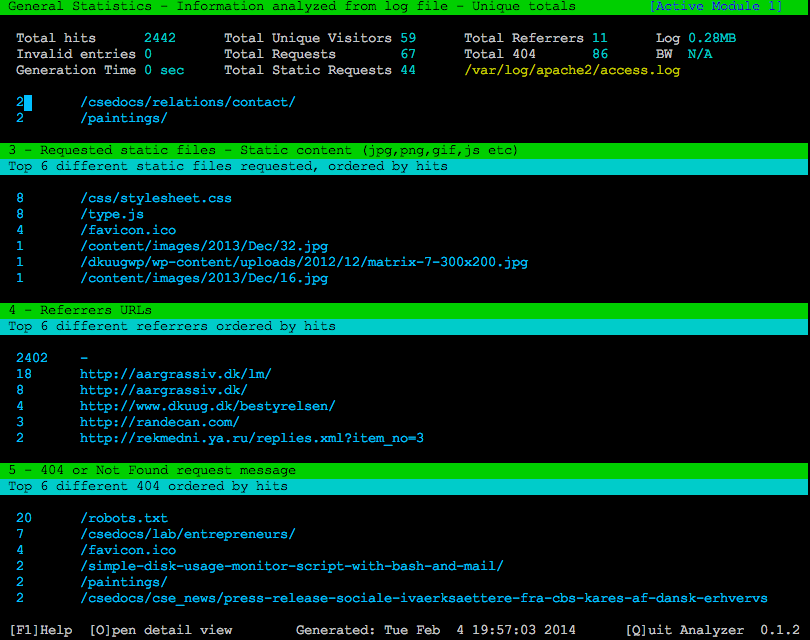
GoAccess is an web diagnostic tool like apachetop i presented in my previous post - GoAccess is just much more great! Much more information, and a great UI. Definitely recommended. Some amazing tools you did not see coming from a simple *nix util.
See more at GoAccess website:
http://goaccess.prosoftcorp.com/
Run with goaccess and the -f flag to choose a log-file, eg.:
goaccess -f /var/log/apache2/access.log
Screenshots:
dstat
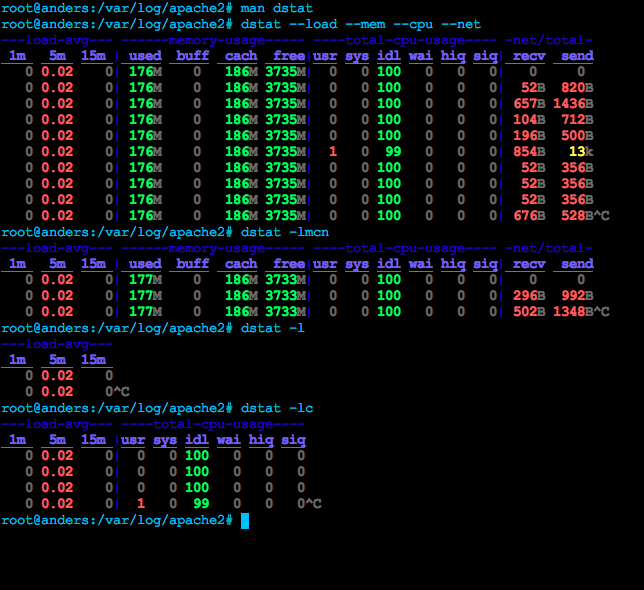
Dstat should be a one-pack replacmenet for vmstat, iostat and ifstat, and i would say that this has been achieved. Dstat is a very flexibile tools with amazing features which you did not get with the other tools, and it writes stdout directly in the prompt. $ man dstat is recommended to see all the awesome features.
You can eg. write $ dstat --disk if you only want to see disk monitor output, and if you need the whole disk/load/cpu/network package or more, you could do $ dstat --disk --load --cpu --net, and separate columns would appear.
Try it out - it is a great and fun way to monitor.
Screenshots:
iftop
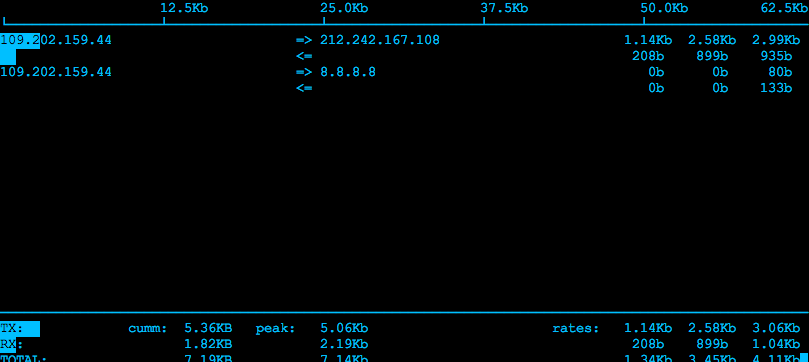
Realtime bandwith monitor which is like the good old top program just for network bandwith. Very clear in the interface what is going with the information you need.
Screenshots:
nload
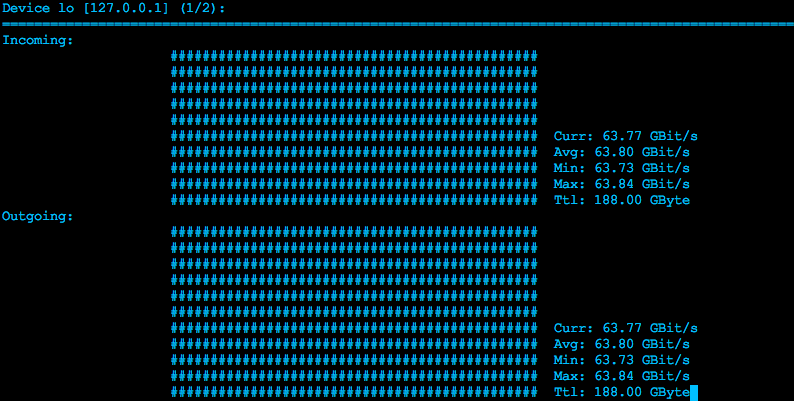
Nload is also a diagnostic tool for network bandwith, but simplifies the information given to this:
"nload is a console application which monitors network traffic and bandwidth usage in realtime. It visualizes the in- and outgoing traffic using two graphs and provides additional info like the total amount of transfered data and min/max network usage." - The Nload man page
Screenshots:
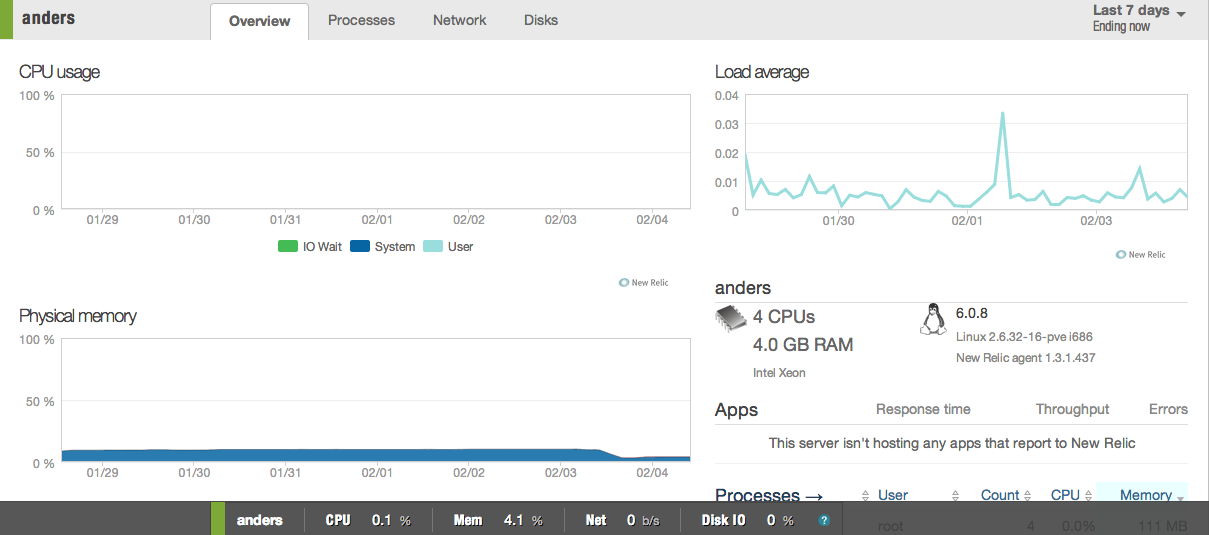
New relic
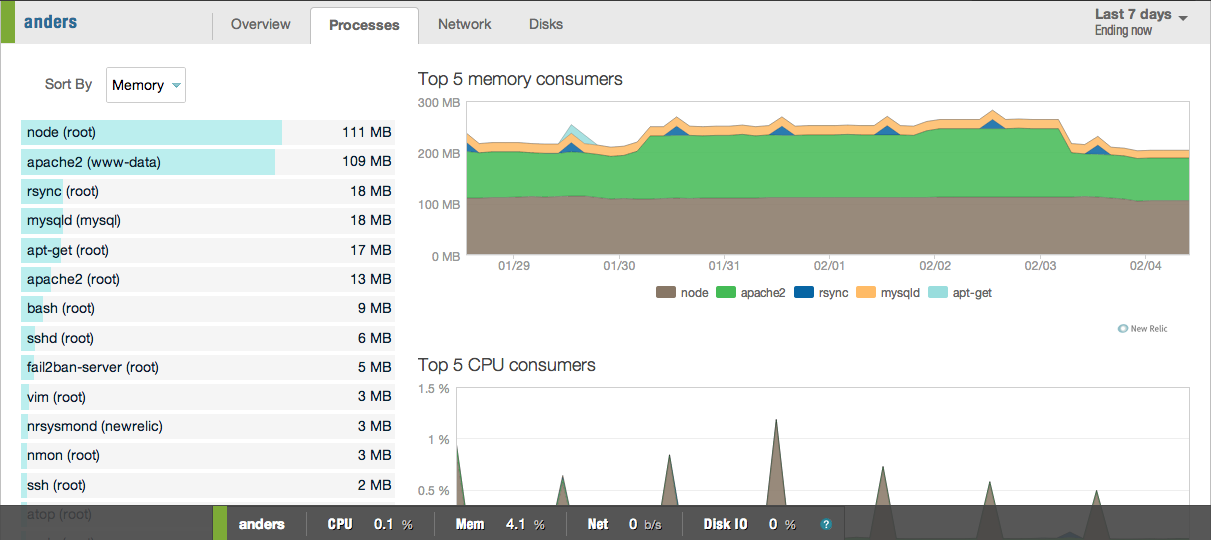
New Relic is amazing, but mostly for application monitoring! It makes no sense to pay if you only need to server monitoring. Then rather use open source tools like Nagios to send alarms, and some of the other mentioned tools to actually recieve information about how your system is doing.
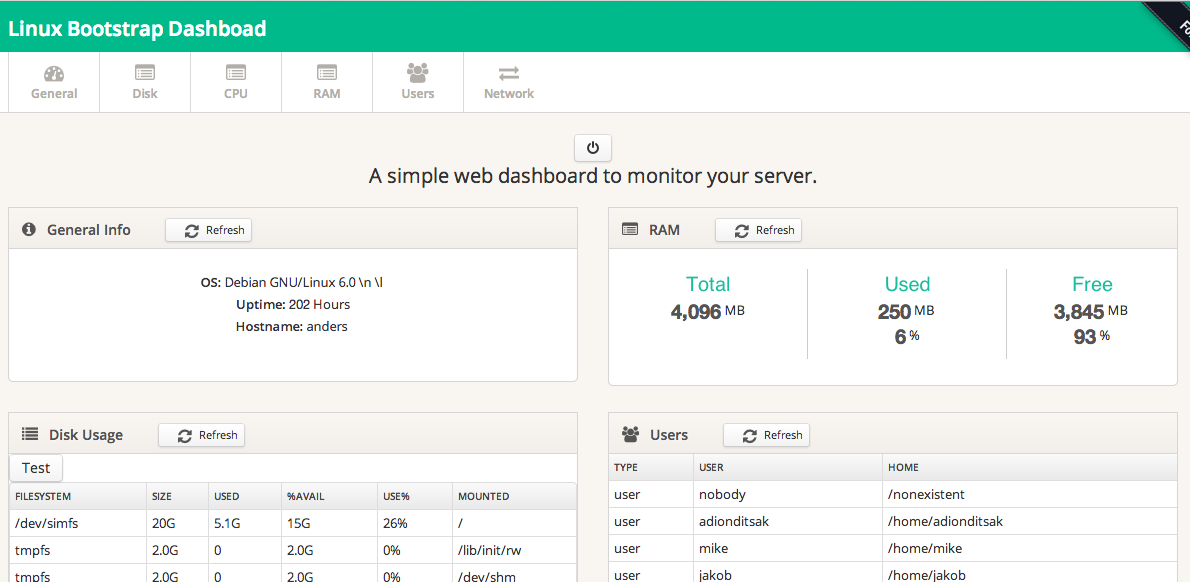
Everything you get from the New Relic server monitor diagnostics, you also get in the Linux Dash - listed under here.
New Relic got a lovely UI tho.
Take a look at their website, to see if it is something for you:
http://newrelic.com/
Screenshots:
Linux-dash
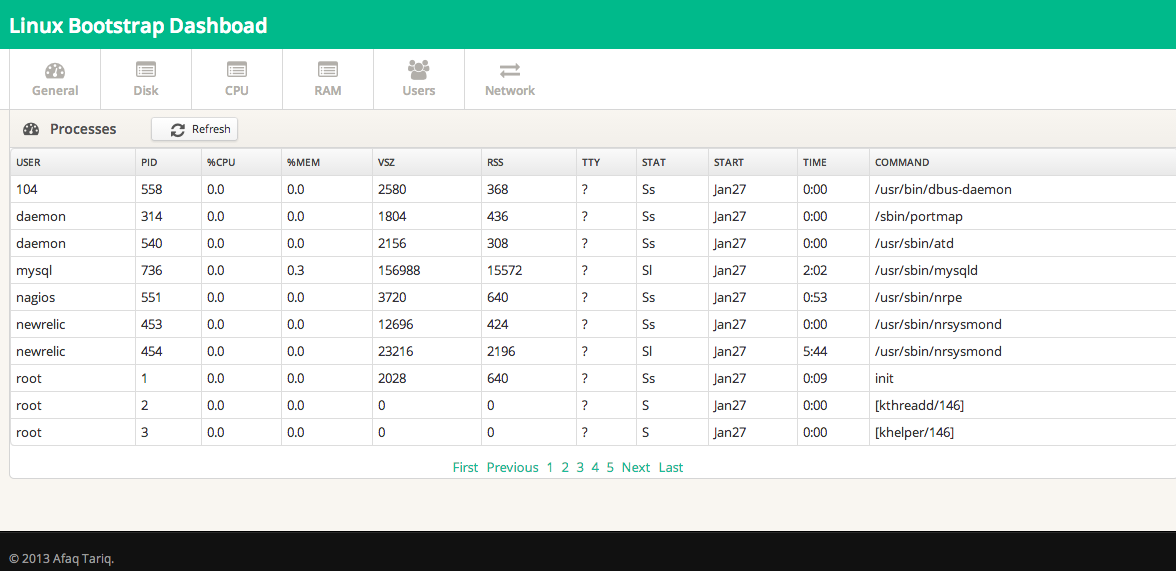
Just after my post Linux Dash went to the Hacker News frontpage aswell, and i understand why. It is so easy to install, and if you do not know how to access server information from the shell Linux dash is super good. It is easily extensible from its architecture which just calls the php exec() function and sends it to an ajax request. I can see this be combined with a server/client program with alarms and it could be very powerful for simple monitoring.
Just git clone Linux dash to a directory which is connected with your web server, and you are up-and-running.
Github:
https://github.com/afaqurk/linux-dash
Screenshots:
